Appendix C: Benchmarking methodology
We set out to investigate the extent to which our workforce would need upskilling to match the qualification profile of the construction sector – a sector that currently has more regulation.
Broad sectors
We started by comparing the highest qualification profile of those in Agriculture, Forestry and Fishing industries (Division A1 on the ANZSIC classification system) in the 2018 census with those in the Construction industries (Division E2).
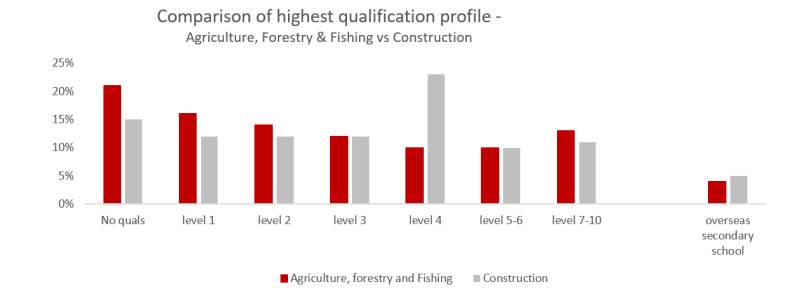
Note: 7% of those working in Agriculture, Forestry and fishing and 6% of those working in Construction did not provide qualification information – the estimates here are for those who provided a response. Research evidence consistently shows that those who do not respond are likely to have lower levels of qualification on average. All estimates and calculations provided here are based on the count of those who responded.
Based on this comparison it was evident that workers in Agriculture, Forestry and Fishing had a lower qualification profile on average, and were more likely to have no qualification (21% vs 15%) or level 1 qualifications (16% vs 12%) and were far less likely to have level 4 qualifications (10% vs 23%) than those working in Construction.
Based on 2018 census workforce estimates, we calculated that in order to double the percentage of people working in the Agriculture, Forestry and Fishing that held level 4 qualifications from the reported 10% to 20%, to bring the estimates closer to Construction – we would need 26,621 of the workers to report having a level 4 qual. With a qualification completion rate of ~65% on average (our analysis suggests this sits between 60-65%) across all subjects this would mean an enrolment of 39,931 people on level 4.
This is a simplified and conservative estimate because 1) the completion rate is lower in Agriculture, Environment and Related studies on average (in 2022 qualification completion rate at level 4 was 47% and programme completion rate at level 4 was 53%) and 2) this estimate does not take into account retention and replacement rates where you might actually need a higher number to account for expected churn in the workforce.
Muka Tangata workforce
We applied the same methodology to those classified as working in the Muka Tangata workforce in the 2018 census. This includes all those whose main job at the time of the census was in one of the ANZSIC codes (industries) assigned to Muka Tangata. The Muka Tangata workforce is a larger group than Agriculture, Forestry and Fishing and the workforce size is larger (187,728 compared to 133,104), nevertheless the qualification profile on average is similar.
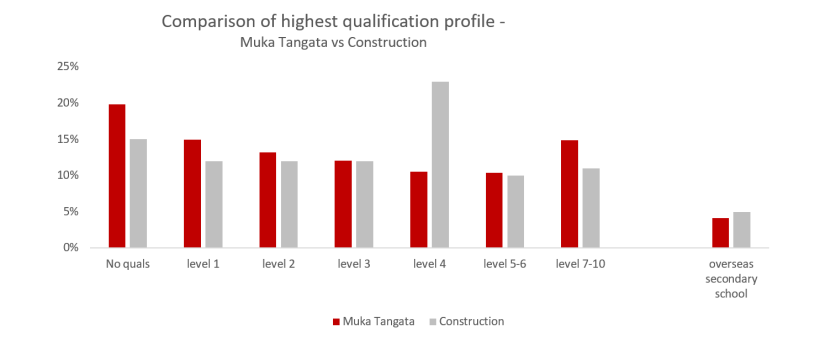
Note: 7% of those working in Muka Tangata industries and 6% of those working in Construction did not provide qualification information – the estimates here are for those who provided a response. Research evidence consistently shows that those who do not respond are likely to have lower levels of qualification on average. All estimates and calculations provided here are based on the count of those who responded.
Based on 2018 census workforce estimates, we calculated that in order to change the composition of the Muka Tangata workforce to have the same rate of level 4 qualification as the Construction workforce – we would need 20,795 of the workers to report having a level 4 qualification. Again applying a completion rate of 65% would mean an enrolment of 32,025 people at level 4.
We also estimated that to reduce the percentage of the Muka Tangata workforce with no qualifications from 20% to 15%, we would need an additional 8938 people to report having at least a level 1 qualification, which would mean 13,751 enrolments.
Individual industry groups
We wanted to see what this looked like for our individual industry groups.
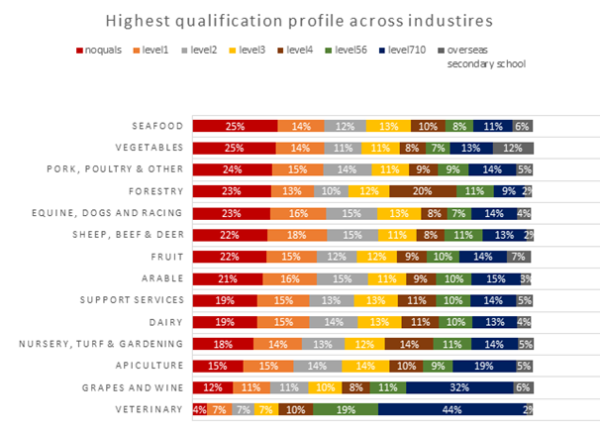
Note: the percentage not providing highest qualification information ranged from 3% in Veterinary to 14% in Fruit. These percentage estimates are based on those with highest qualification information available. Research evidence consistently shows that those who do not respond are likely to have lower levels of qualification on average.
We calculated how many learners would be required in order to change the percentage of workers with level 4 qualifications in each of our industry groups to be the same as the Construction benchmark (23%). We noted that some of our industry groups had a high qualification profile overall than construction – most notable veterinary and Grapes and wine. Across all other industries there is a higher percentage with level 1 or below qualifications than construction, even where there are higher percentages of graduates. Forestry is interesting in that it does have a higher percentage of level 4 qualified people than any other Muka Tangata industry – but still a very high percentage of workers with no qualification.
Excluding Veterinary and Grapes and Wine, the table below represents the shift in worker numbers and learner numbers required with a level 4 qualification to obtain a 23% share of the workforce in each industry group, using the same methodology described above and the same assumed completion rate of 65%.
Table 1. The estimated change in the number of workers and learners with level 4 required to match Construction benchmark.
| INDUSTRY GROUPS | WORKFORCE NUMBER CHANGES | ENROLMENTS REQUIRED |
| Apiculture | 317 | 488 |
| Arable | 330 | 508 |
| Dairy | 4555 | 7008 |
| Equine, dogs and racing | 547 | 841 |
| Forestry | 268 | 413 |
| Fruit | 1680 | 2585 |
| Nursery, Turf & Gardening | 1299 | 1999 |
| Pork, poultry & other | 602 | 927 |
| Seafood | 990 | 1523 |
| Sheep, beef & deer | 5111 | 7863 |
| Support services | 3550 | 5462 |
| Vegetables | 838 | 1289 |
We ran a similar exercise to ascertain changes required to reduce the number of workers with no qualifications to be in line with the Construction estimate of 15%.
Table 2. The estimated change in the number of workers and learners with at least level 1 qualification required to match Construction benchmark.
| INDUSTRY GROUPS | WORKFORCE NUMBER CHANGES | ENROLMENTS REQUIRED |
| Apiculture | 0 | 0 |
| Arable | 137 | 210 |
| Dairy | 1575 | 2424 |
| Equine, dogs and racing | 285 | 439 |
| Forestry | 659 | 1014 |
| Fruit | 794 | 1221 |
| Nursery, turf & gardening | 452 | 696 |
| Pork, poultry & other | 357 | 550 |
| Seafood | 79 | 1223 |
| Sheep, beef & deer | 2449 | 3769 |
| Support services | 1260 | 1938 |
| Vegetables | 529 | 813 |